DSP architecture solutions for multiple needs
In the past, harmonic analyzers were not only very expensive, but also difficult to integrate into large-scale manufactured meters. Therefore, harmonic analysis of the power grid is very difficult and can only be performed occasionally by professional operators at certain locations. Today, the chip can not only integrate more signal processing functions, but also has smaller size and lower price, enabling efficient use and monitoring of the power grid.
Over the past few decades, power systems have grown exponentially, and their nonlinear characteristics have caused severe harmonic pollution. This can have adverse effects in many ways, such as overheating and premature aging of electrical equipment, increased transmission line losses, and failure of relay protection. Therefore, the industry is paying more and more attention to harmonic pollution problems and has taken various measures to achieve better grid management. One of the best methods is to set up more observation and analysis points in the grid and extend the monitoring time. With the accelerated deployment of smart meters around the world, the best devices to meet these requirements will be used. The ASIC for smart meters combines energy metering and harmonic analysis, making it the ideal solution for the moment. Please keep in mind that considering the large amount of DSP resources to be embedded in a chip, it must be cheap, small in size, and low in power consumption. It is hard to imagine spectrum analysis. This article will discuss a DSP architecture solution that attempts to meet all of these needs.
Fundamental frequency estimation and spectral component extraction
There is a dynamic balance between the changing load on the grid and the relatively constant output. This results in a slight decrease in the mains frequency at higher loads and a slight increase in the mains at lower loads. . In countries where the grid is highly developed and closely monitored, the frequency offset is quite small, but in areas with poor grid control, the frequency offset may be large enough to affect electrical equipment. To this end, the industry has done a lot of research work, trying to find the most effective way to achieve tracking frequency by optimizing various parameters such as accuracy, speed, noise and harmonic immunity.
In terms of the safety, stability and efficiency of the power system, the frequency of the grid is an equally important operating parameter as current and voltage. Reliable frequency measurements are a prerequisite for effective power control, load mitigation, load recovery, and system protection.
There are many ways to detect and estimate the frequency. For example, the zero-crossing method detects the frequency by measuring the time interval between two successive zero-crossing points. The advantage of this method is that it is very easy to implement, the disadvantage is that the accuracy is low, and it is susceptible to harmonics, noise, DC components, and the like. The DFT-based algorithm can use the sample sequence to estimate the frequency, but it is very sensitive to harmonics in the input signal. For the DSP architecture described in this paper, we examined a digital PLL-based approach that was found to be effective, highly immune, and provide accurate frequency estimation.
Figure 1 shows the standard digital PLL structure and its three main modules. The phase error detector sends the output to the loop filter, which further controls a digital oscillator to minimize phase error. Therefore, an estimate of the fundamental frequency of the input signal can ultimately be obtained. The control loop is optimized to provide optimum lockout parameter performance over a standard grid frequency range of 45 Hz to 66 Hz.
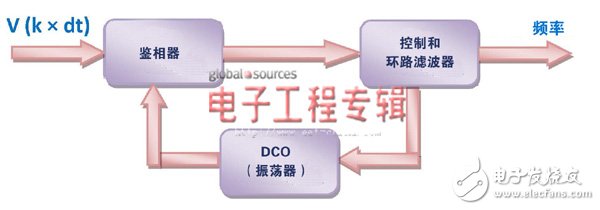
Figure 1. Frequency estimation based on digital PLL structure
Knowing the exact frequency of the components to extract from the spectrum, we can examine the various options for extraction. When it comes to spectrum analysis of sampling systems, we naturally think of using the discrete Fourier transform (DFT) tool to map signals from the time domain to the frequency domain. There are a variety of numerical algorithms and processing architectures dedicated to implementing this transformation, and FFT is one of the best known. Each method has its advantages and disadvantages compared to the amount of information extracted and the amount of DSP resources required.
One AC power system theory uses phasors in a complex plane to represent voltage and current, which is consistent with a DFT variation that provides spectral components in a similar format. Fundamentally, the same effect can be achieved by directly implementing the DFT formula at the target frequency. However, in order to make the measurement real-time, we use a recursive method to obtain the summation element from the DFT formula. There are many implementations (depending on the available DSP resources), but one important aspect must be tightly controlled, which is to minimize the errors caused by spectral leakage and noise.
Figure 2 illustrates in block diagram form the working principle of spectral component extraction.
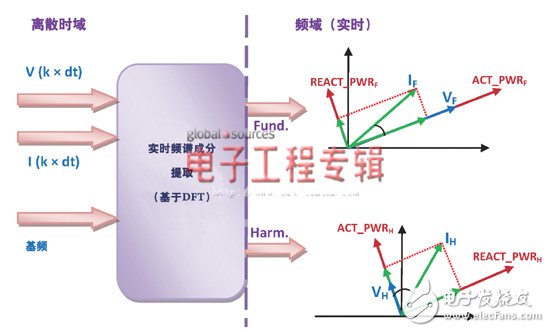
Figure 2. Extracting the fundamental and harmonic spectral components
The sampled voltage and current of a phase are passed along with the fundamental frequency value through a calculation module that provides the calculation results in phasor form. A pair of phasors (voltage and current) is provided for each fundamental frequency and some user-selectable harmonic frequencies. With these components, we can use the known methods in power theory to extract RMS values ​​and power. The RMS value is equivalent to the magnitude of these phasors, and the apparent power is equal to the product of these magnitudes. The active power is obtained by projecting the current phasor directly onto the voltage and multiplying the two. Another orthogonal element that decomposes the current is multiplied by the voltage to obtain reactive power.
Having said that, we will discuss the possible advantages (motivations) of using real-time methods. For example, this architecture is a good way to monitor the inrush current in a transformer. This current occurs during the energization of the transformer and is caused by partial cycle saturation of the core. The initial amplitude is 2 to 5 times the rated load current (and then slowly decreases) and has a very high second harmonic, and the 4th and 5th harmonics also carry useful information. If you only look at the total RMS current, the inrush current may be mistaken for the short-circuit current and may incorrectly cause the transformer to exit service. In order to identify this situation, an accurate real-time value of the second harmonic amplitude must be obtained. When we only need information on several harmonics, using a full FFT transform may not be very efficient.
This method of selectively calculating several harmonic components may be more efficient than the FFT method, and the so-called third harmonic sequence is another good example. Sometimes you need to pay special attention to the odd harmonics of the third harmonic (3, 9, 15, 21.). In grounded Y-type systems, these harmonics become an important issue when current flows on the zero line. It causes two typical problems: zero line overload and telephone interference. Occasionally, the third-order harmonic sequence voltage drop of the neutral line causes severe distortion of the line-to-zero line voltage, causing some equipment to malfunction. The solution presented in this paper can monitor only the zero line current and these harmonics on the sum of all phase currents.
Top-level DSP architecture
The above DSP module has been added to an existing architecture that calculates the total RMS value and power based on the basic formula. We also added a component for calculating multiple power quality factors. First, we calculate harmonic distortion (HD) to normalize all harmonic RMS values ​​based on the fundamental RMS value. Then, using the total RMS value and the fundamental RMS value, we calculate the total harmonic distortion plus noise (THD+N) according to the standard definition. Finally, all power factors are extracted based on the ratio of active power to apparent power. As shown in Figure 3, all three phases perform all of these signal processing in parallel, with the exception of the harmonic analysis module, which can only be assigned to a phase at any given time.
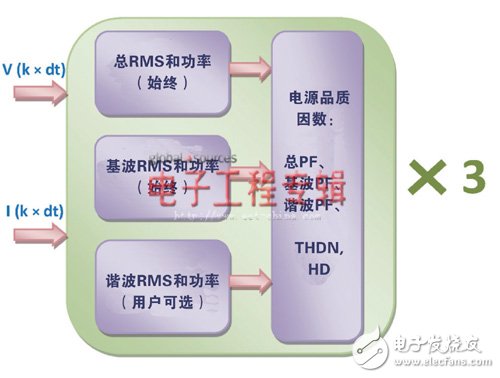
Figure 3. Top-level DSP architecture
By calculating the harmonic power factor, you can find the harmonic source in the grid. While the industry is still controversial about the best way to find major harmonic sources, one of the traditional methods is based on "the flow direction of active power." This is equivalent to identifying the active power sign for that particular harmonic frequency at a point or points in the system. When operating at a distorted voltage, the linear load produces active power for each harmonic, and if there is a nonlinear component at the client, the power enters the network. This value can be determined by measuring the phase angle of the contaminated harmonic voltage and current and then calculating the difference. This is not necessary in this architecture because the harmonic power factor can provide this information.
This DSP architecture has been successfully implemented on three-phase energy metering devices. It has the following hardware resources: a single MAC architecture with an operating clock frequency of 16 MHz and a signal sampling rate of 8 kHz with a 1k word data memory. The fundamental measurements of all three phases are continuously calculated, and the harmonic analyzer can continuously extract three random harmonic values ​​from a given phase (A, B or C). The architecture is scalable and some performance parameters have been optimized based on known grid operating conditions.
Although it is not a shortcoming to not provide all harmonic values ​​at once, we must remember that the most important effect of harmonic pollution in the power grid is the quasi-stable phenomenon. In fact, for industrial and commercial loads, it is recommended to analyze harmonic contamination for at least one week, and avoid any sporadic measurements. Under the above premise, with the versatility of the architecture, the user can obtain approximate FFT results by scanning all available harmonic content on all three phases.
Conclusion
In the past, harmonic analyzers were not only very expensive, but also difficult to integrate into large-scale manufactured meters. Therefore, harmonic analysis of the power grid is very difficult and can only be performed occasionally by professional operators at certain locations. Integrating more signal processing functions into small, economical chips will revolutionize this situation and open the door to more efficient understanding and use of the grid, benefiting both power companies and consumers. The DSP architecture described in this article is now integrated into a device from Analog Devices, Inc., one of the newest devices (ADE7880) from the ADI Energy Metering Division for the multiphase market.
Description of Stacked D-Sub I/O Connectors
Antenk's connectors are designed for applications requiring multiple connector ports with limited PCB space
The condensed footprint of Antenk's dual port D-sub solution is available in four industry sizes, three connector spacing options, and six hardware configurations for one of the broadest stacked D-sub offerings on the market in standard and high-density variations.
Stacked D-sub I/O connectors are designed for applications requiring multiple connector ports with limited PCB space. Two right angle D-sub connectors are stacked one on top of another, creating a single dual-port connector with a very condensed footprint.
Features of Stacked D-Sub I/O Connectors
Available in four industry standard sizes:
Standard density: 9, 15, 25, 37
Available in three connector spacing options: 0.625", 0.750", 0.900"
Available in six hardware configurations
High-temperature UL94 V-0 thermoplastic (260°C process temp)
High performance stamped contacts
Applications of Stacked D-Sub I/O Connectors
Communications
Instrumentation
Medical
Computers/peripherals
Commercial industry
Test labs
Gaming industry
Range of of Stacked D-Sub I/O Connectors
Male Stacked D sub Connector
Female Stacked D sub ConnectorStandard Density Stacked D sub Connector
High Density Stacked D sub Connector
Dual-Port Stacked D-Sub Connectors
Dual Port (Stacked) D Sub,,Stacked D Sub I/O Connectors,Dual-Port Stacked D-Sub Connectors,Male Stacked D sub Connector, Female Stacked D sub Connector, Standard Stacked D sub Connector, High Density Stacked D sub Connector
ShenZhen Antenk Electronics Co,Ltd , https://www.antenkcon.com